Hello From the Data Side

There’s almost nothing more frustrating than the feeling that your work is going unseen.
You’ve spent time creating beautiful pages, documenting decisions, and building helpful content – but is anyone actually using it?
With Confluence Analytics (a Premium and Enterprise feature), you’ll find out!
🤷 Never Heard of It?
If Confluence Analytics doesn’t ring a bell, chances are you’re working with the Standard plan. Here, you can still see who viewed a page and when.
-
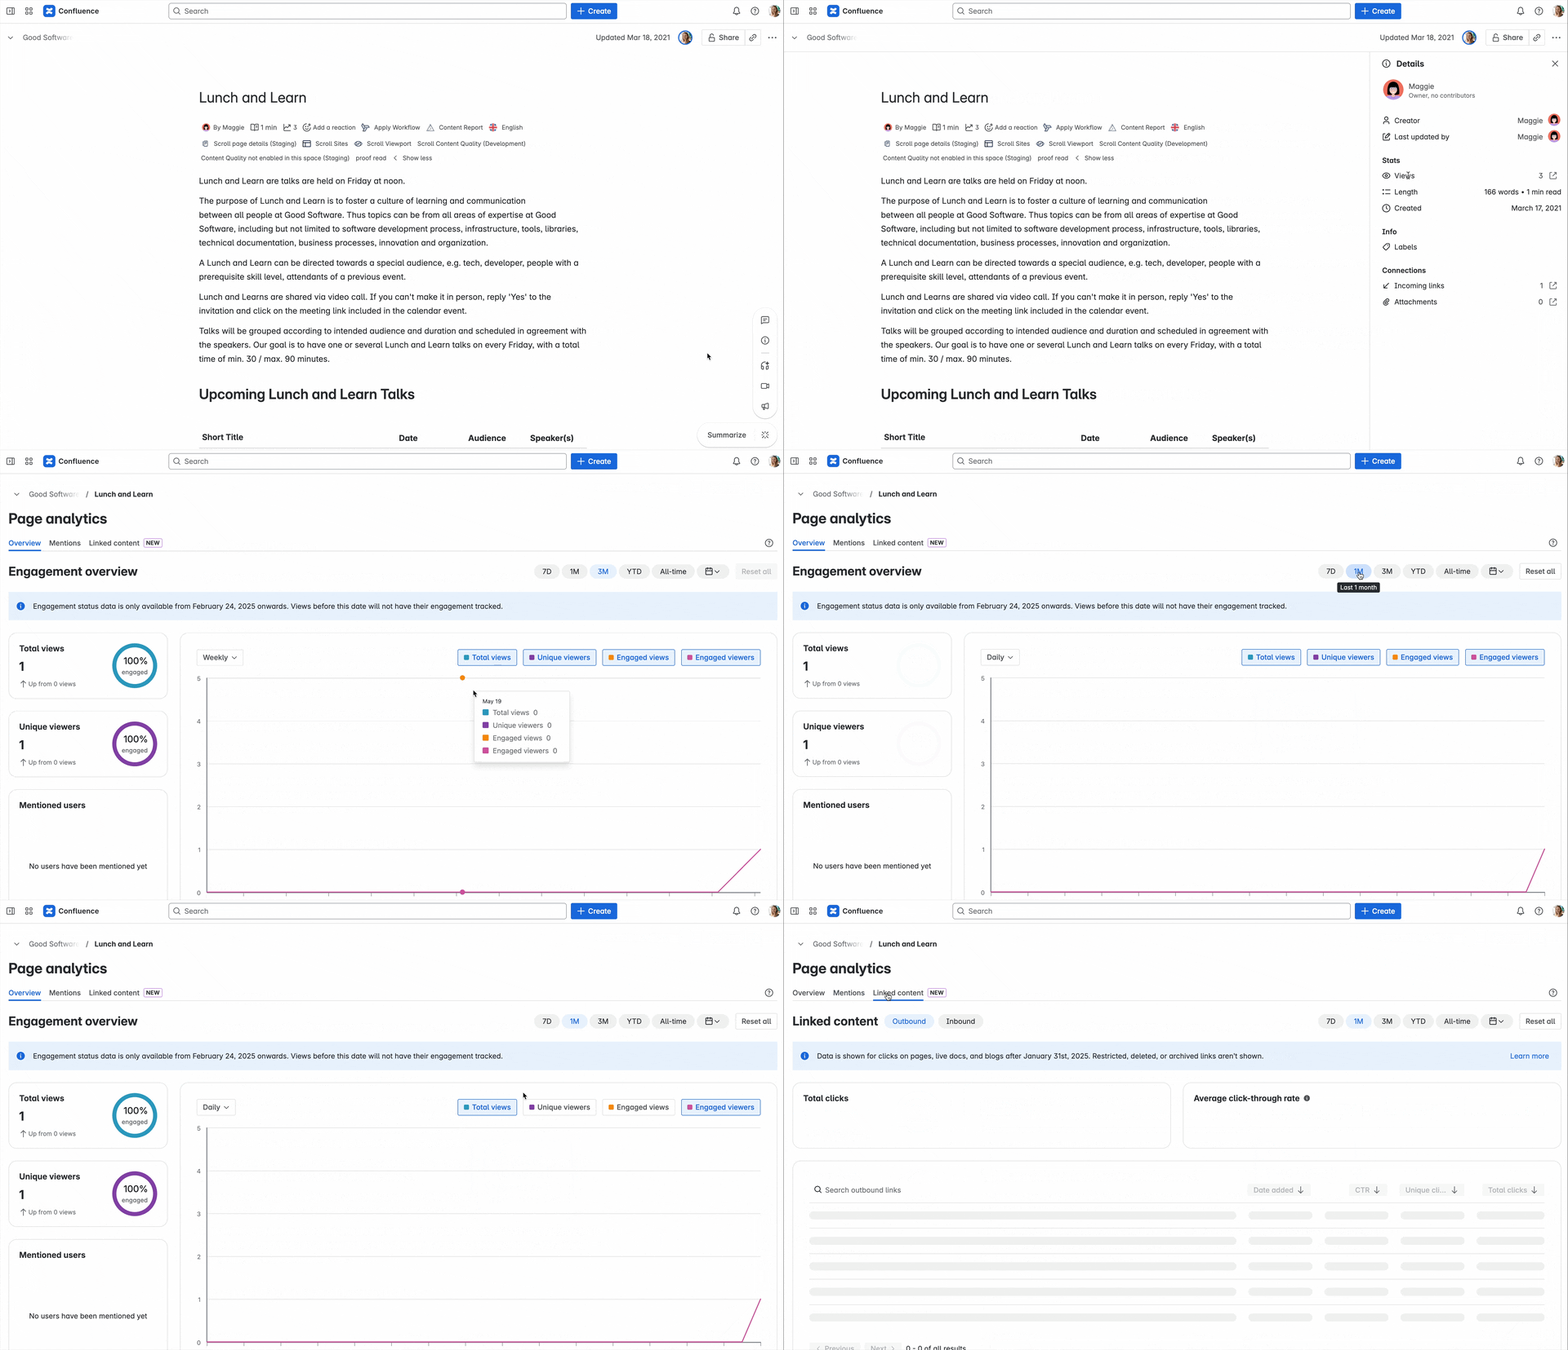
Just open a page and click the little “i” icon in the floating panel on the right: “Show details.” This opens a side panel where you’ll see some quick statistics, like how many people have viewed the page. Click on the number of views to open a more detailed breakdown.

That gives you a quick look. Helpful, but limited. What you don’t get is the full dashboard with filters, search insights, and the contributor activity. On Confluence Premium or Enterprise, you unlock a full analytics dashboard.
🔎 Dig Into Real Insights
If you’re on Premium or Enterprise and want the full picture, you:
-
Open Confluence.
-
Click Apps in the left navigation.
-
Choose Analytics.

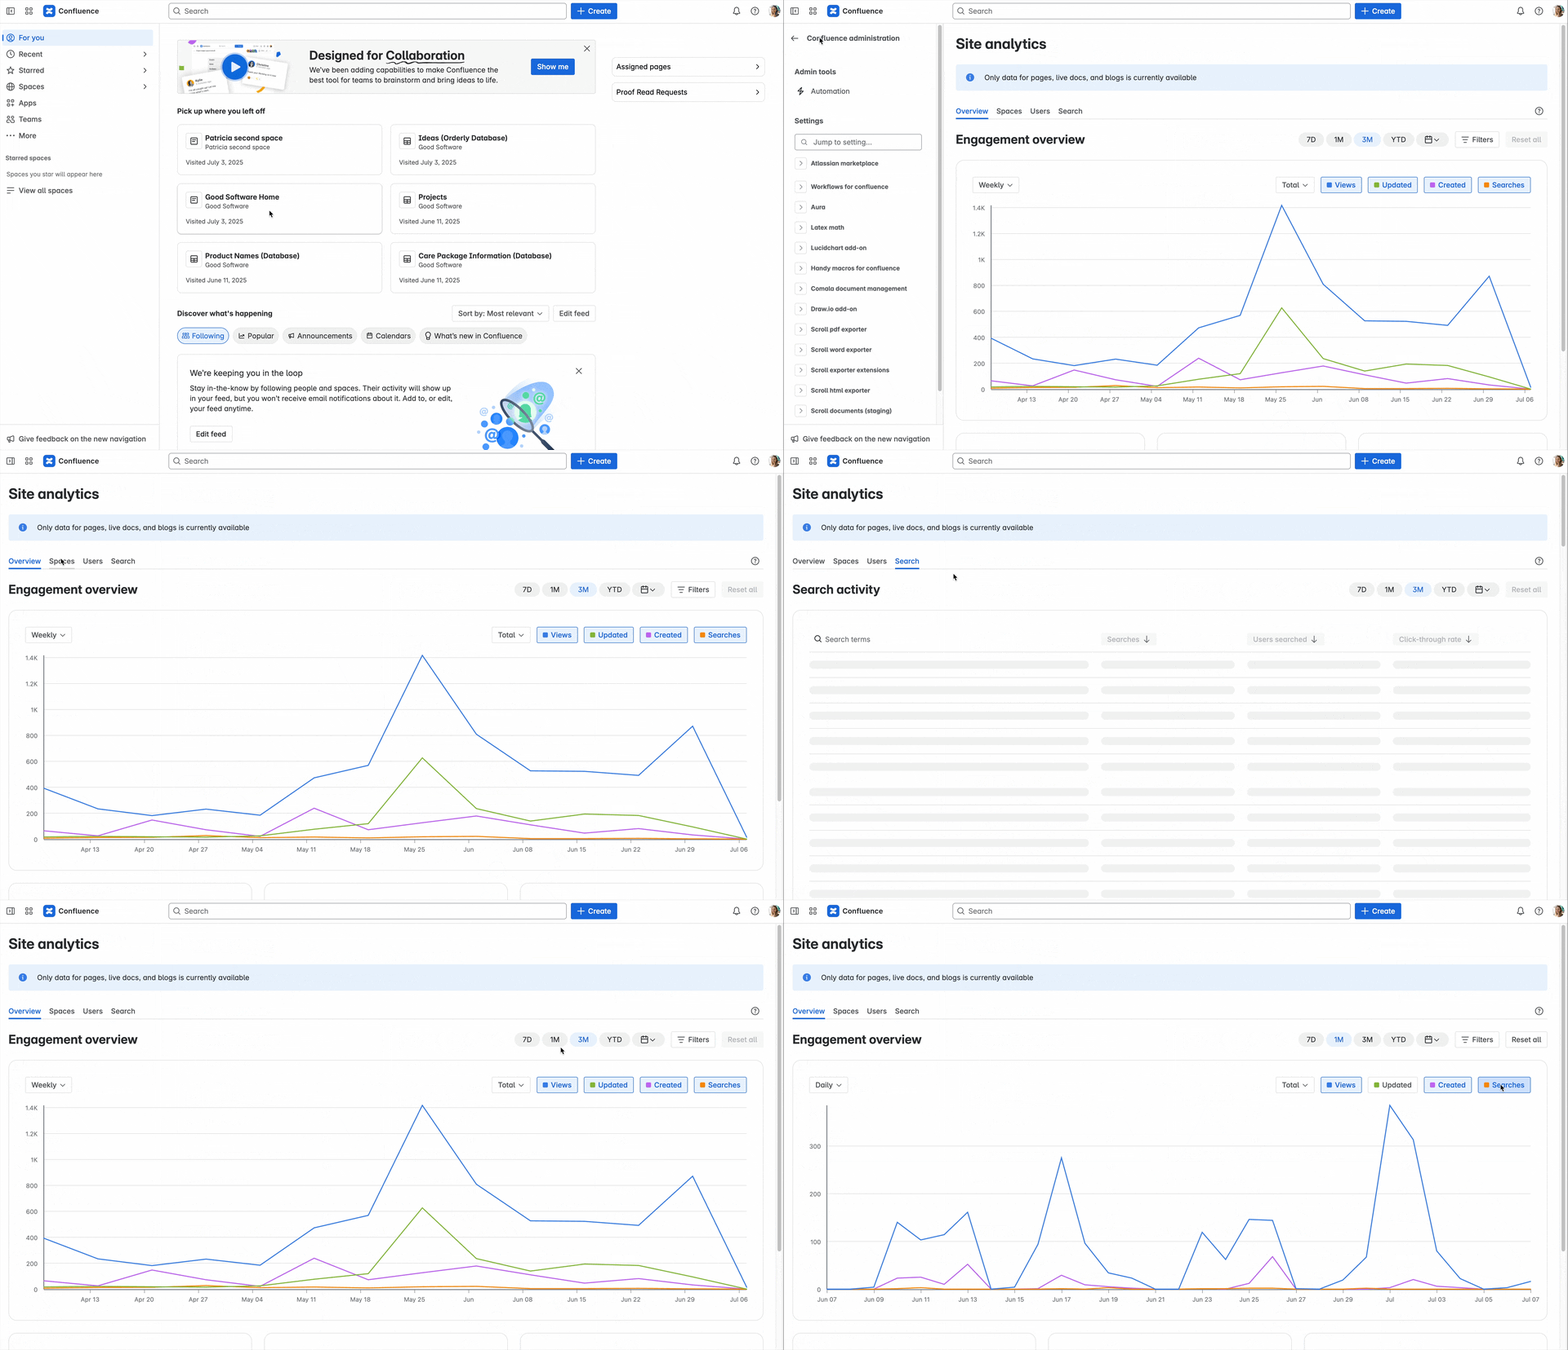
That takes you to the dashboard, where you can switch between four views:
Confluence analytics shows you a dashboard, where you can switch between four views:
-
Overview: Activity across your Confluence site: page views, edits, creations, and searches over time.
-
Spaces: Find out which spaces and pages are most active.
-
Users: Who’s creating, editing, and reading the most content.
-
Search: What your teammates are searching for, and whether they’re finding useful results.
💡 From Insights to Action
So what does this mean in practice? Here’s how we at K15t put it to work:
🧹 Clean up what’s no longer useful
We regularly filter by “not viewed in 90 days” to uncover outdated content. Then we decide: archive it, update it, or merge it with something more relevant.
📈 Highlight what’s working
Some pages get steady views week after week – analytics help us spot those and make sure they’re always accurate, helpful, and easy to find.
🧠 Find knowledge gaps
If our teammates are searching for things we haven’t documented yet, that’s a clear sign. We use those signals to guide what content we create next.
👥 Understand team habits
The Users tab shows us who’s reading, editing, and sharing content. It’s helpful for onboarding, coaching contributors, or improving support workflows.
📊 Knowledge is Power
When you know what’s working (and what’s not), you can create content with real impact. That’s why we at K15t love using Confluence Analytics! Want to explore more? Then have a look at Atlassian’s documentation and check out our video about Confluence Analytics.
Confluence News
🧪 Go Big in Confluence
Ready to take up more space? Atlassian is testing a new full-page module for Confluence Cloud apps. This lets your app take over the entire page – perfect for dashboards, editors, custom views, or anything that needs room to breathe. It’s still in early access, and Atlassian is looking for feedback.
Snag your spot now and help shape what’s next.
🔁 Automate More, Maintain Less
New advanced automation components are rolling out in Confluence Premium and Enterprise. You can now connect entire processes within a single rule – reducing the number of rules you need to manage. Run steps in parallel with branches at the same time, or organize actions using Rule groups.
From K15t

🚀 All New AI Experiences
Join Matt Reiner and John Hooper next week for a 60-minute live stream as we explore how Rovo, your AI teammate, is transforming how teams work in Confluence.
📅 Jul 16, 4:00 – 5:00 PM (GMT+2)