Confluence is where teams document decisions, share knowledge, and keep work visible. But creating pages is only half the story. To learn whether your content is actually working, you need to understand how people use it. Enter Confluence Analytics.
Confluence Analytics gives you a clear, data‑driven view of how your site, spaces, and pages are performing, and helps you answer questions like:
-
Are people engaging with the content we publish?
-
Which spaces or pages are most useful?
-
Where are users struggling to find what they need?
This page walks you through how Confluence Analytics supports real‑world use cases – from high‑level adoption tracking down to individual page performance – and how you can act on the insights you see.

Licensing, Access, and Getting Started
Confluence Analytics is available on:
-
Confluence Premium
-
Confluence Enterprise
If you expect to see Analytics (at the site, space, or page level) but don’t:
-
An admin may need to grant you access to site analytics.
-
Space permissions might need to be adjusted so you can view analytics for specific spaces or pages.
Once your access is set up, you can begin with a simple routine:
-
Look at site analytics to understand overall activity and popular spaces.
-
Dive into space analytics for the teams or projects that matter most.
-
Use page analytics on key content to see what’s working and what isn’t.
-
Act on the insights – rename, restructure, promote, or archive as needed.
Each level has its own unique scope and detail level.
Over time, this turns Confluence from a passive content store into an actively managed knowledge hub.
Seeing the Big Picture: Site‑Level Usage
At the top level, Confluence Analytics helps you understand how active your whole site is over time. This is especially useful if you’re responsible for rollout, adoption, or the overall success of Confluence in your organization.
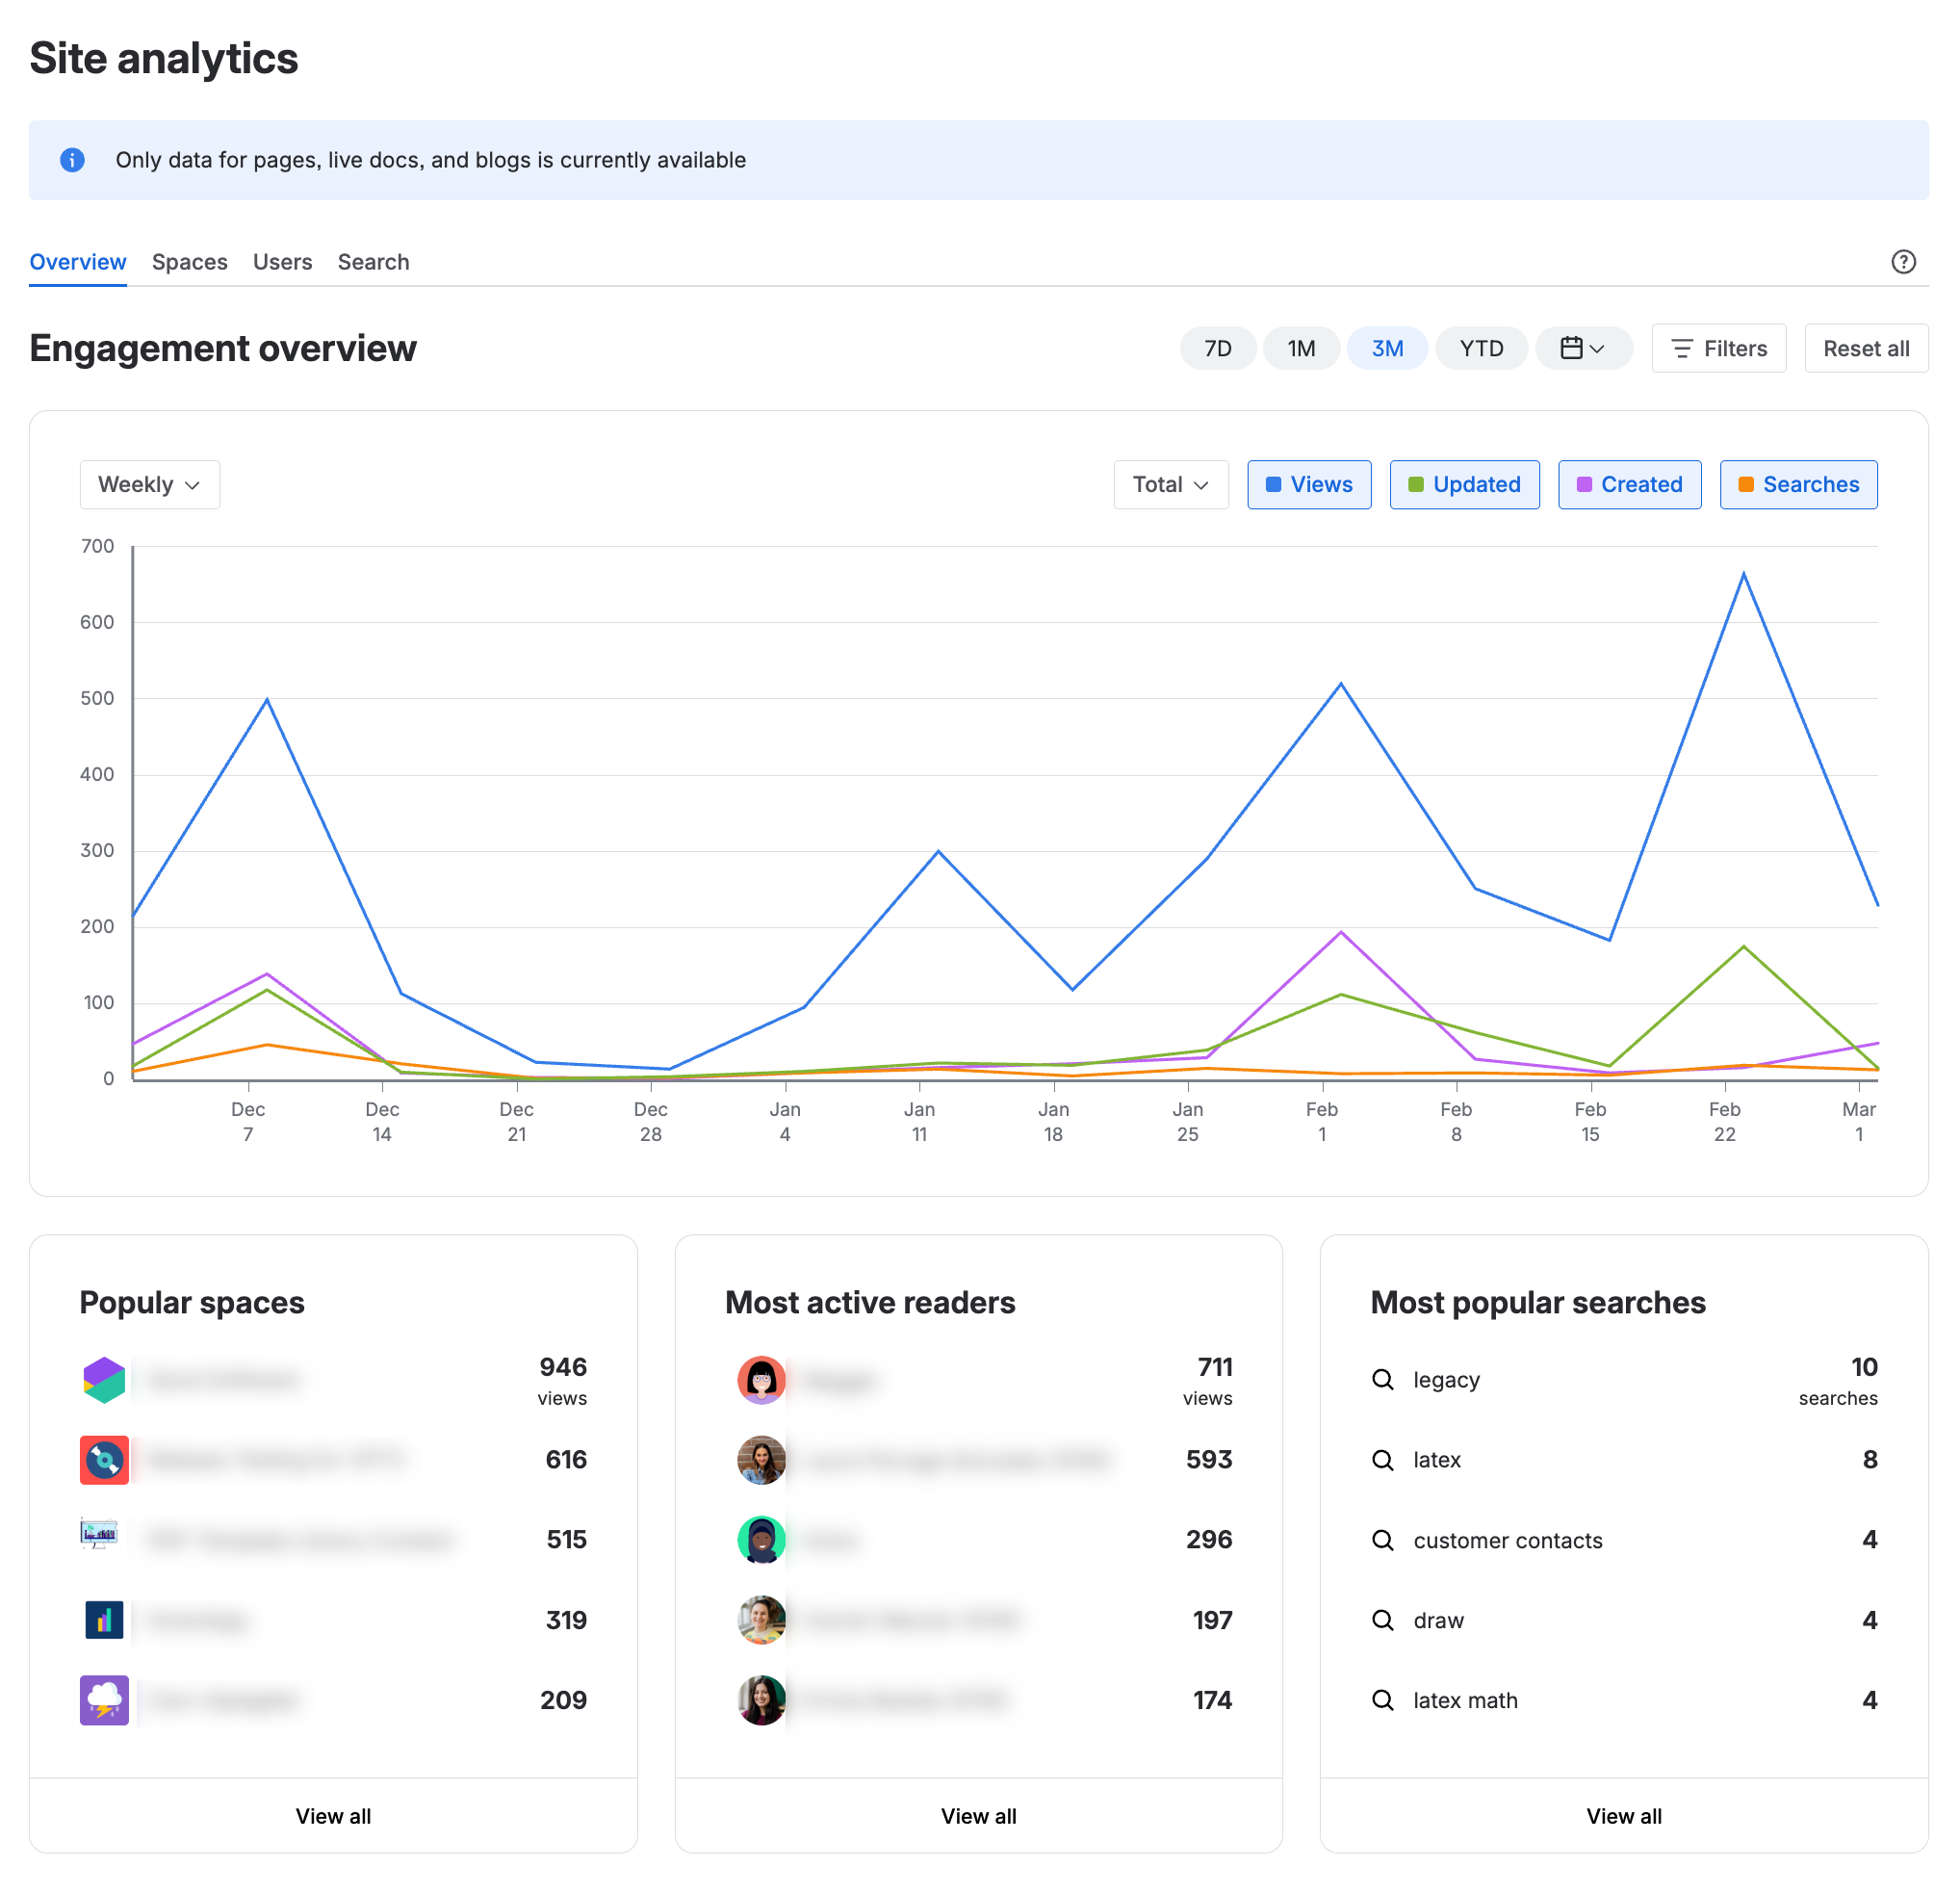
On Confluence Premium and Enterprise, you can open Apps → Analytics in the top navigation to see site‑wide analytics. There, an interactive activity chart shows you how content is being created, updated, and viewed over time. You can adjust the date range, group the data by periods such as months, and focus on different types of content (standard or team spaces, personal spaces, and blogs).
This high‑level view helps you:
-
See whether your investment in Confluence is paying off.
-
Track how usage changes after launches, training, or internal campaigns.
-
Compare how different content types perform over time.
If you don’t see Analytics in the menu, a Confluence or space admin may need to grant you access.
Evaluating Space Performance and Discoverability
Once you know how Confluence is doing overall, the next question is: which spaces are actually working?
In site analytics, the Popular spaces lists highlight spaces with the most views and interactions. These are your high‑traffic hubs – the places where people are clearly finding value.
Spaces that don’t appear in these lists may be:
-
Hard to discover or poorly linked.
-
Outdated or unappealing.
-
Barely communicated to the wider organization.
Analytics gives you a nudge to take action. You can improve findability by renaming pages so their titles clearly reflect their content, and by restructuring page trees to make navigation more intuitive. You can then promote important spaces through blog posts, home pages, team overviews, and onboarding guides, so people know where to go.
Instead of guessing which spaces to fix, you can use the data to decide where to focus your cleanup and restructuring work.
Understanding Engagement: Champions, Lurkers, and Gaps
Confluence Analytics also gives you insight into how people use your Confluence, not just what content exists.
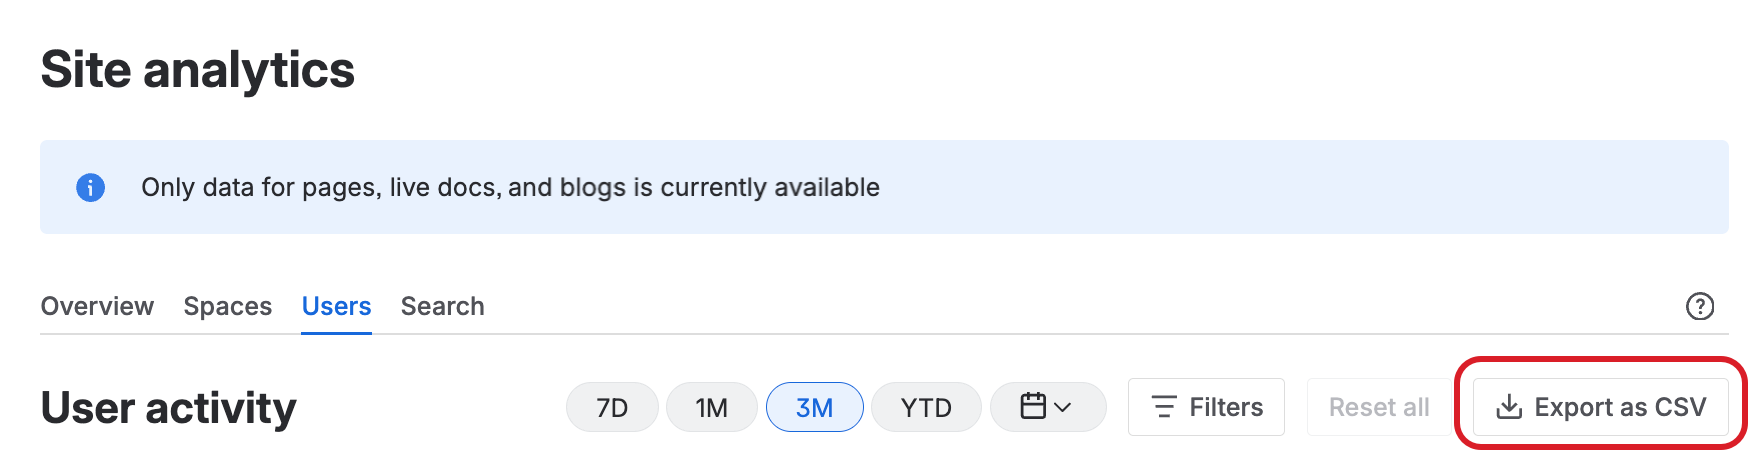
The User activity view shows which users are creating content, reading pages, commenting, and searching. Flexible filters let you zoom in on the groups or behavior that matter to you.
From this, patterns emerge:
-
High‑activity users are your natural champions – people who create, curate, and comment frequently. They’re great candidates to involve in content structure decisions, naming conventions, and best‑practice sharing.
-
Low‑activity users may point to onboarding issues, a lack of permissions, or a split tool landscape where people create content elsewhere and only paste results into Confluence.
-
They may also reveal accounts that belong to former employees and should be removed to keep your analytics clean.
-
Instead of assuming who your power users are, you can identify them with data, and support them in making Confluence better for everyone.
Fixing Findability: What Searches and CTR Tell You
Search is one of the main ways people navigate Confluence. If search results don’t match user expectations, people get frustrated, re‑create content, or give up.
The Search activity panel in Analytics shows you what people are searching for, along with a crucial metric: click‑through rate (CTR) – the percentage of searches that result in someone clicking on a result.
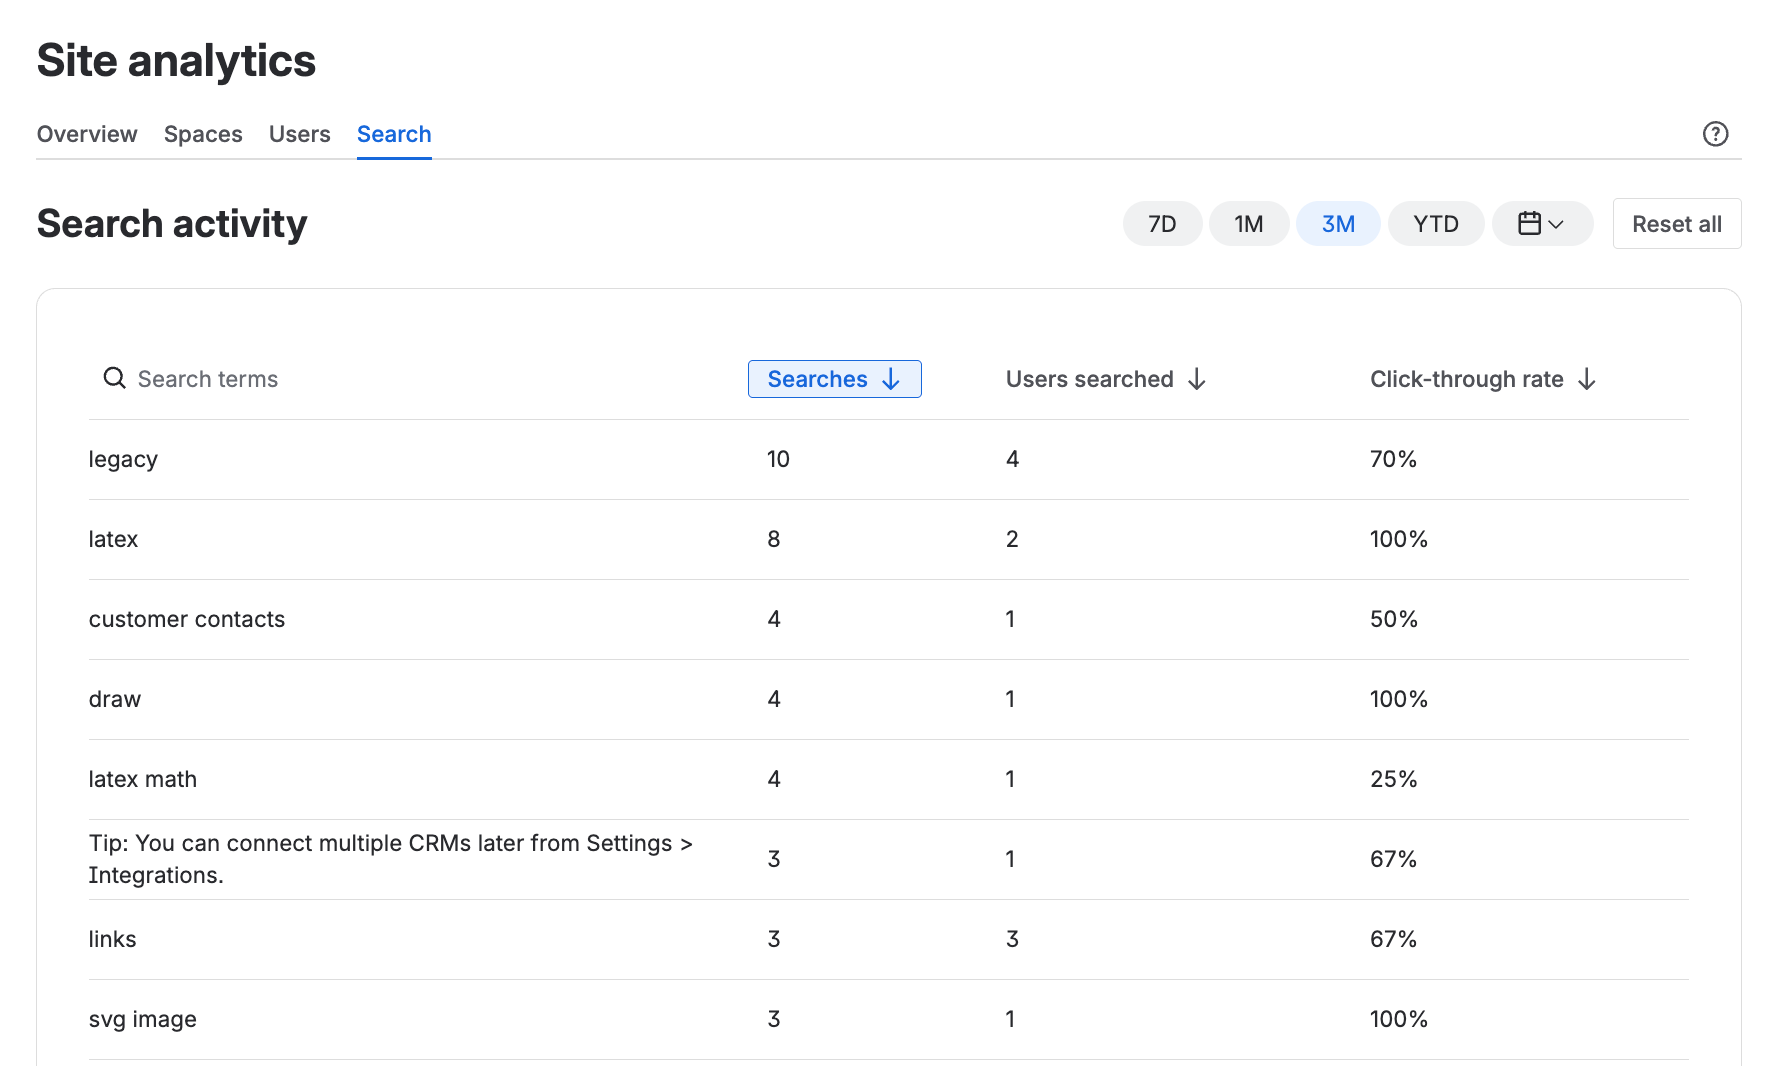
A low CTR around a particular search term tells you that:
-
Page titles may not clearly signal relevance to the search.
-
There might not be a good overview or landing page for that topic.
-
Search results may be crowded with similar pages, making it hard to choose.
With that insight, you can:
-
Rename pages so they reflect the language people actually use.
-
Create overview or landing pages for broad topics, and link out to the most important subpages.
-
Curate search results by improving titles and structure, so the “right” content stands out.
Over time, this reduces duplicate content and search frustration, and makes Confluence feel more like a well‑organized knowledge base and less like a content dump.
Going Deeper: Exporting Analytics for Custom Analysis
Sometimes you need to go beyond the built‑in charts. Confluence Analytics supports that by letting you export data to a CSV from many of its views.
Once exported, you can:
-
Build custom charts and dashboards.
-
Run detailed pivot‑table analysis.
-
Combine Confluence data with metrics from other tools or systems.
This is especially powerful for larger organizations, or whenever you want to include Confluence usage in broader reporting and decision‑making.
Using Space-Level Analytics for Content Clean-Up
Zooming in from the Confluence site level, space‑level analytics let you tune and maintain a single team or project space.
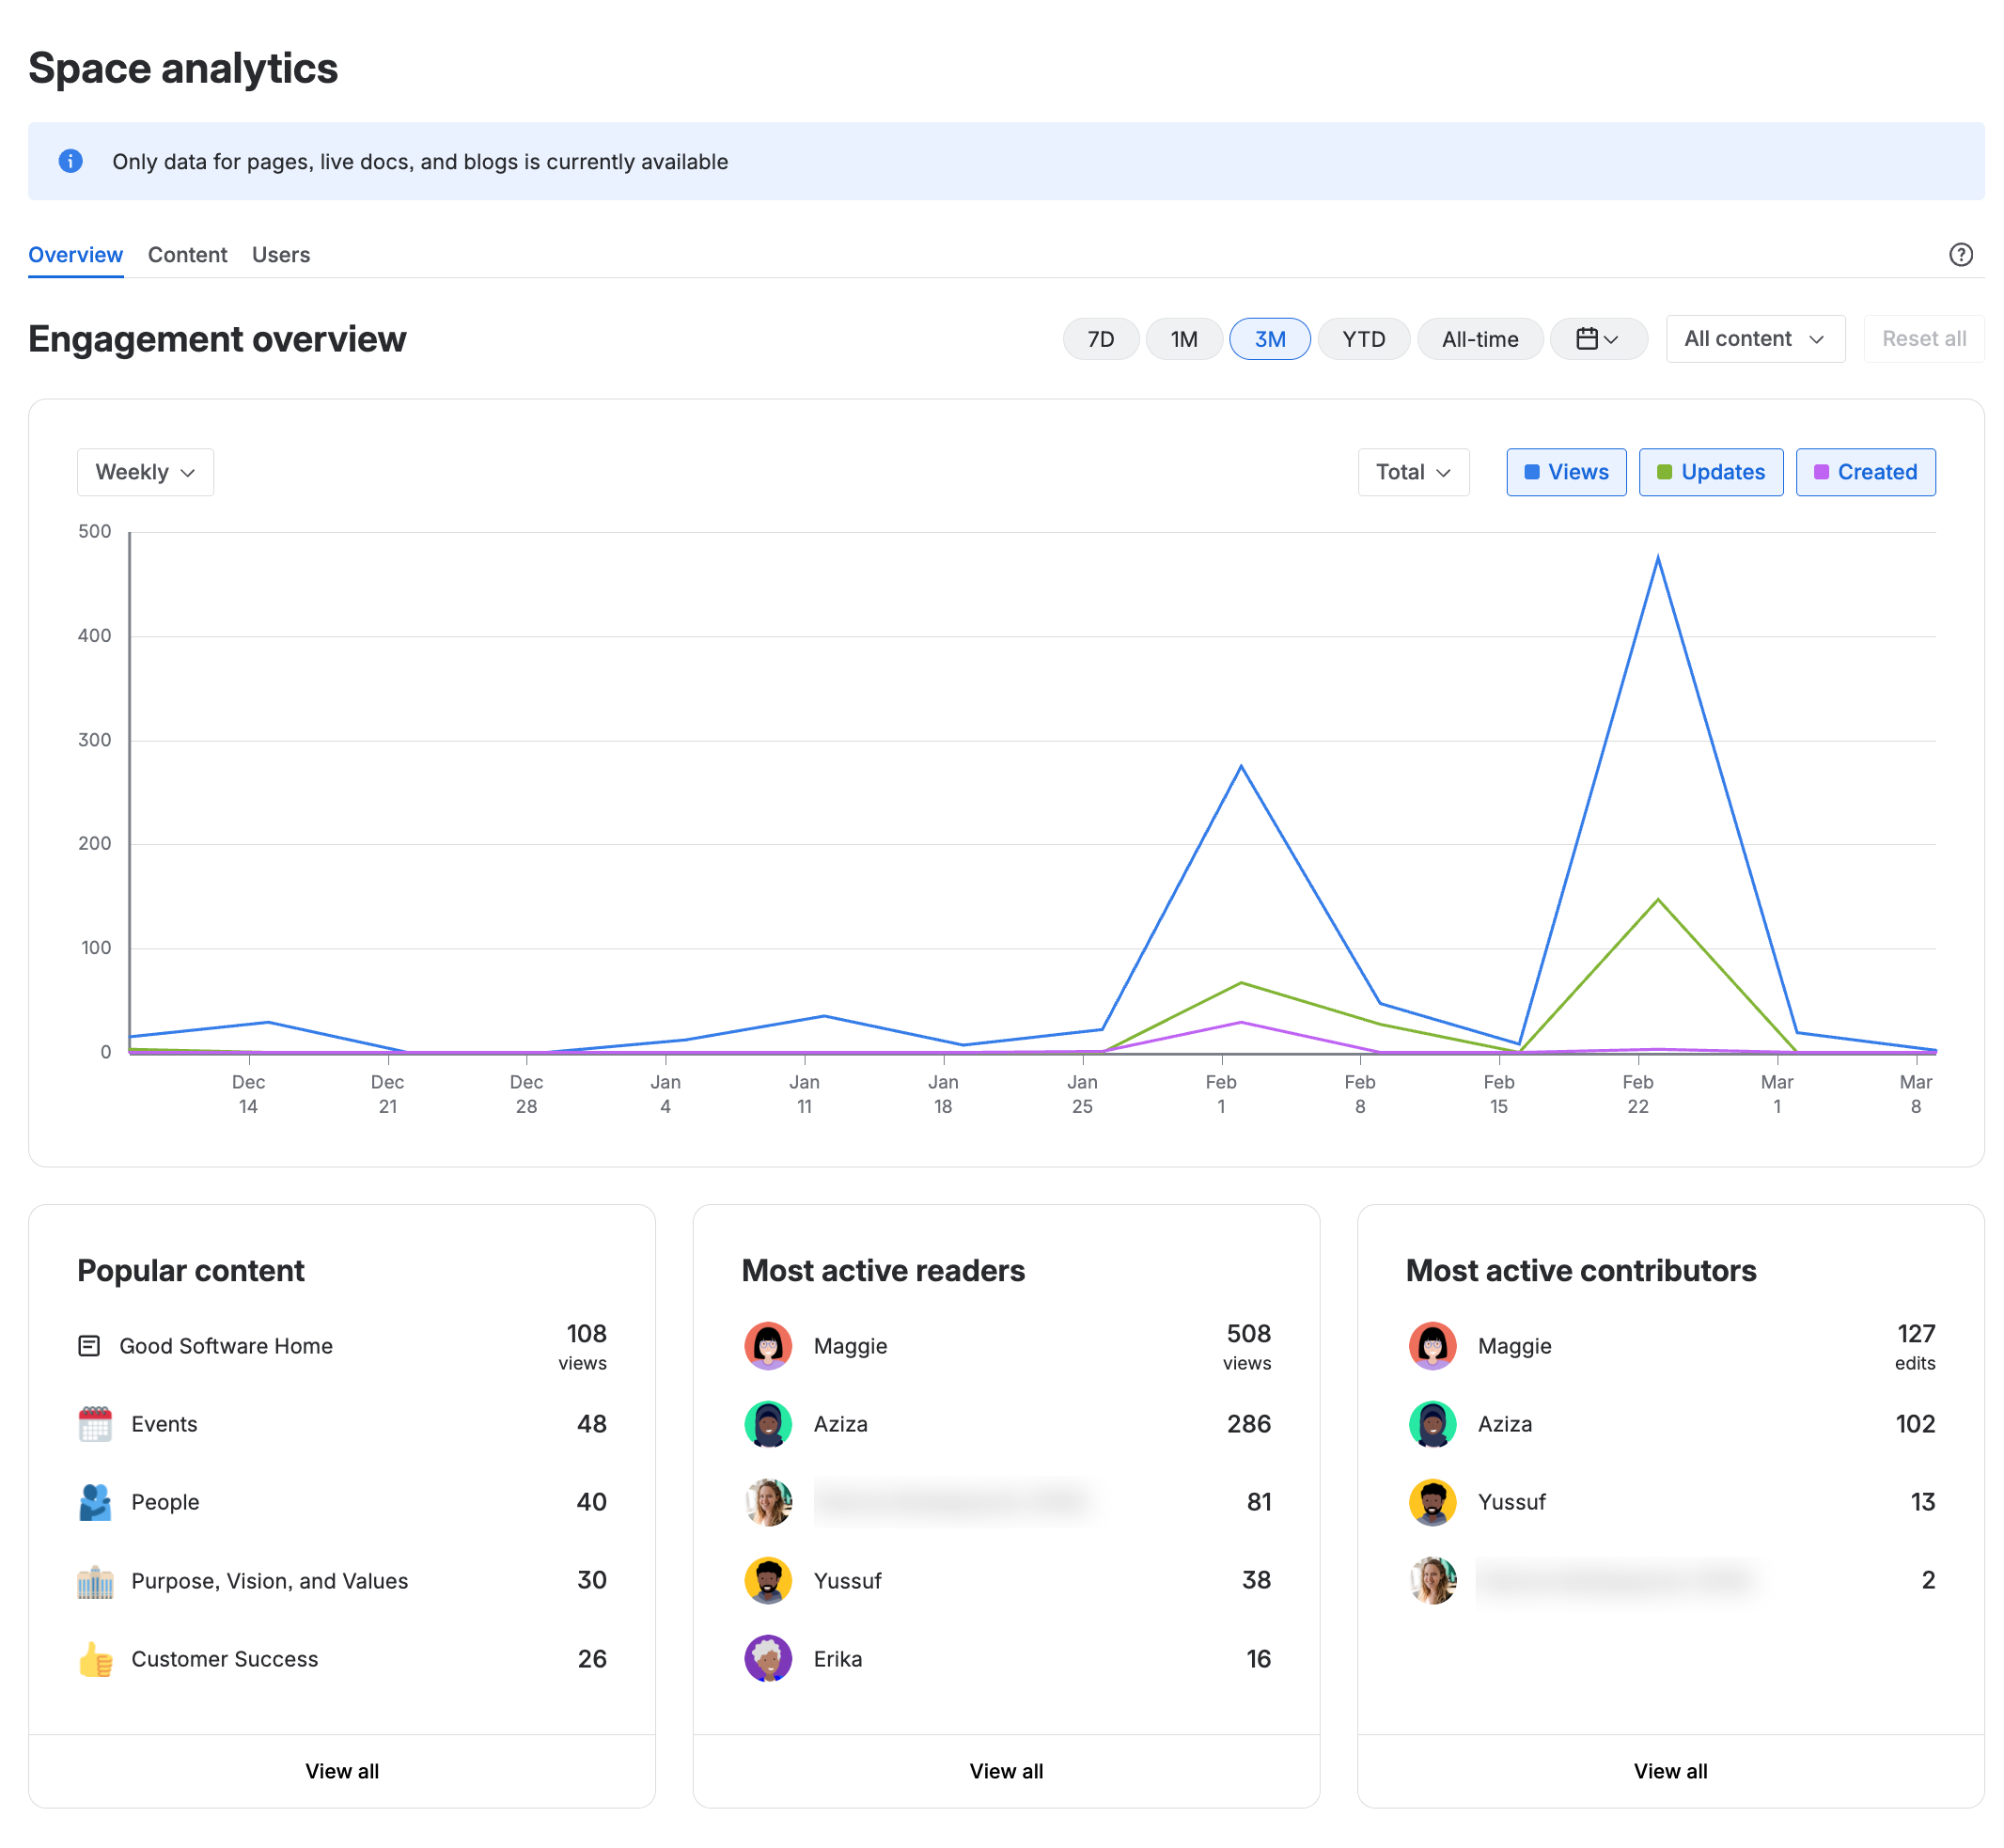
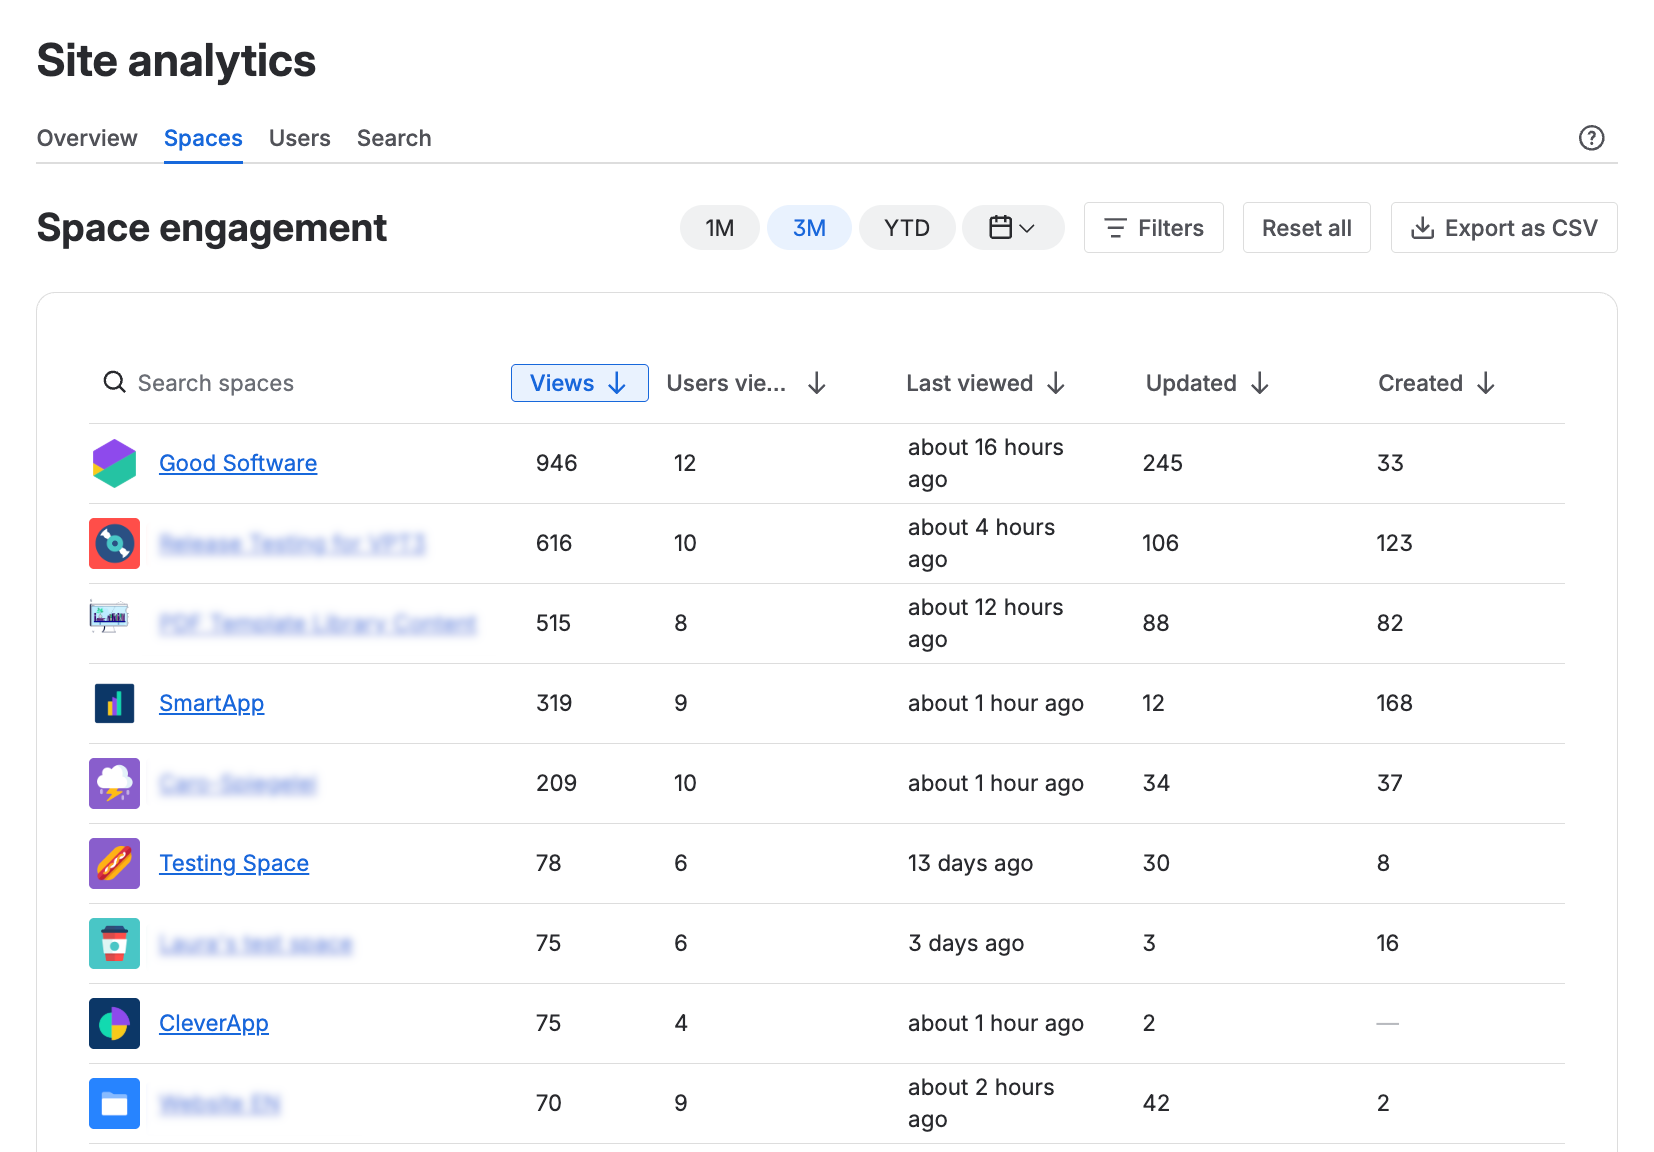
From the space sidebar, you can open Analytics (with the right permissions set by your admin) to see a layout similar to the site view, but scoped to that space alone. Here, you’ll find Popular pages and Most active contributors and readers for that space.
This helps you:
-
Identify which are truly important, based on views and interactions.
-
Spot low‑performing but critical pages that may need better titles, links, or updated content.
-
Decide what to keep, update, archive, or delete, using actual usage data instead of gut feeling.
-
Confirm whether restrictions or permissions are unintentionally hiding important content.
-
See who is most active in that space and recognize them as subject matter experts or key stakeholders.
With this information, you can run targeted clean‑ups and content refreshes space by space, rather than trying to overhaul everything at once.
Evaluating Pages: Are They Doing Their Job?
Sometimes the question is extremely specific: “Is this page still useful?” in the context of other pages in this space?
Under the Content tab, you will find a list of pages with basic traffic details.
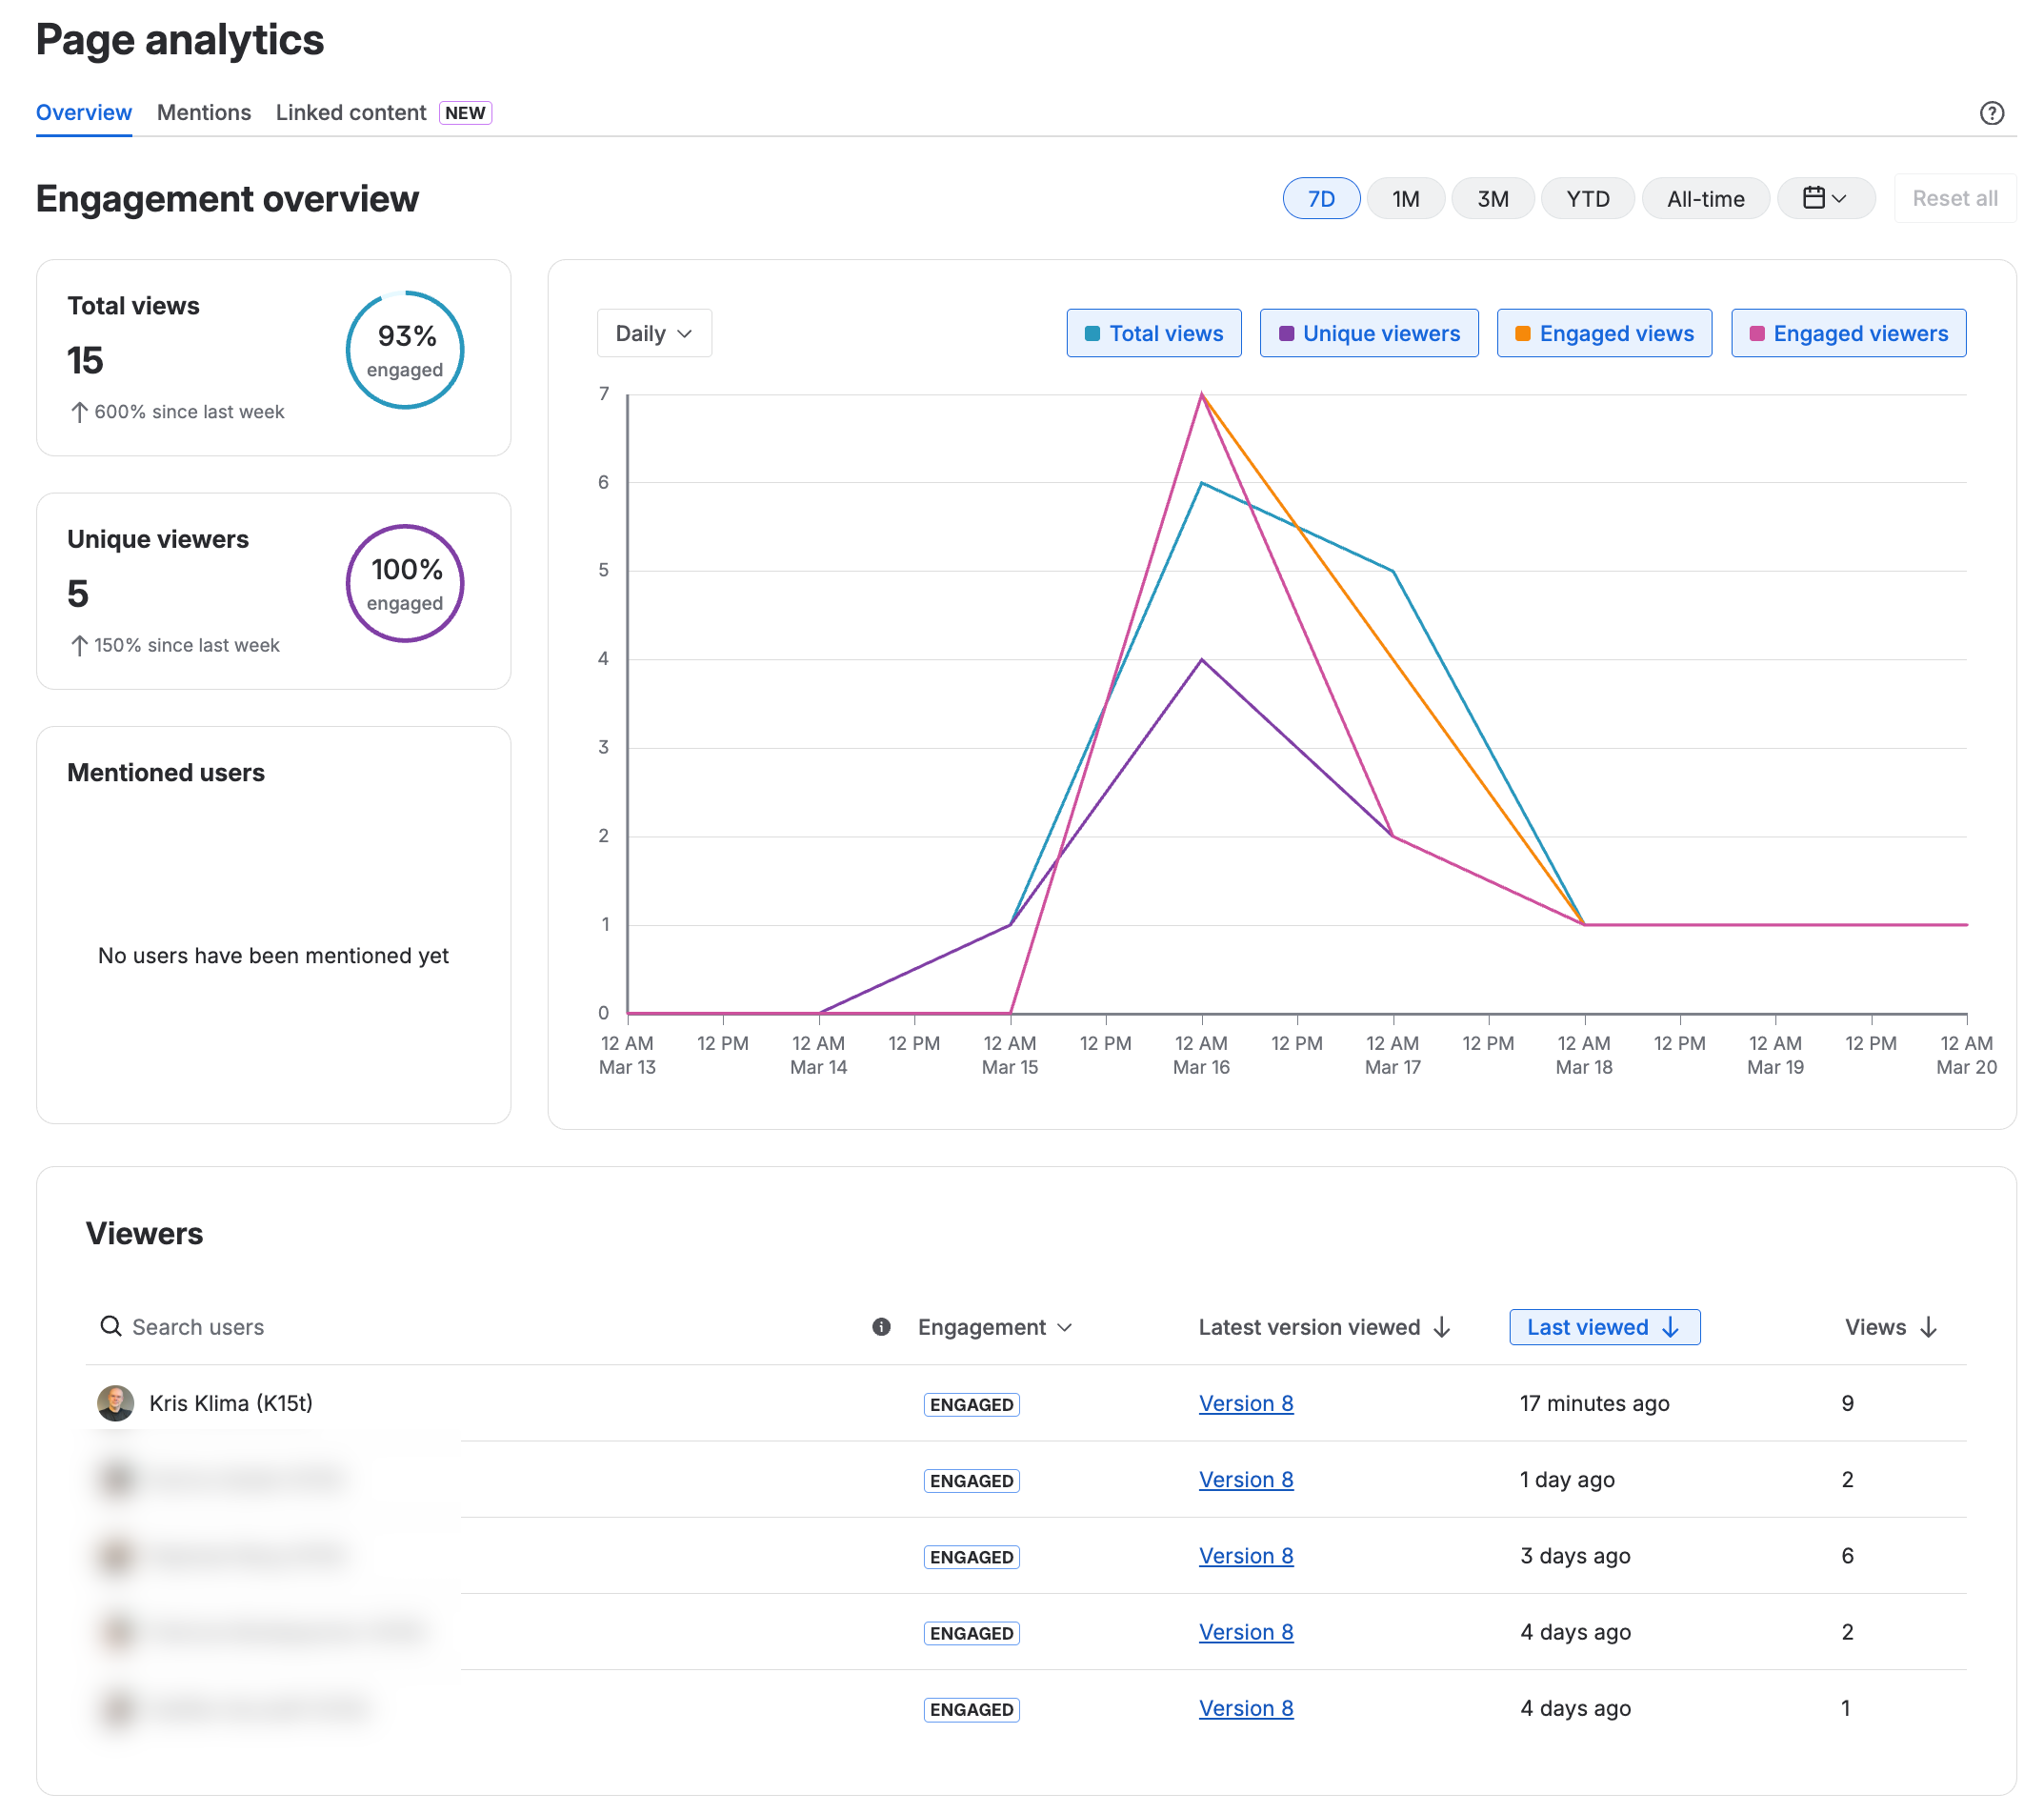
Single Page Analytics
Let’s now drill into a single page.
By the way, page analytics is available for the standard Confluence tier too.
Simply click the Page details icon in the bottom right corner, then click the up-arrow in the Stats section of the panel that opens. This will give you access to look up details pertaining to the use of a single page, including efficiency of incoming and outgoing links.
Why Confluence Analytics Matters
Whether you’re looking at your entire Confluence site, a single team space, or one critical page, Analytics gives you the information you need to:
-
Keep content fresh, accurate, and relevant.
-
Improve findability and structure.
-
Encourage engagement and contribution.
-
Make Confluence genuinely valuable for your teams.
At K15t, we focus on using Confluence in the best possible way. Confluence Analytics is one of the key tools that makes that possible – because it lets you stop guessing and start improving based on real usage.
If you want to dive deeper into best practices:
-
Visit the K15t YouTube channel and look for our series on Confluence best practices and related resources.
Common Analytical Traps in Documentation
In content analytics, it is easy to mistake high engagement for high quality, but data without context is often a hall of mirrors. A spike in time on page might suggest a deep, captivated reader, or it could signal a user trapped in a confusing technical labyrinth.
Conversely, a page with zero traffic isn't necessarily obsolete; it might simply document a process so intuitive that users don't need a map – yet that map remains a vital safety net for compliance or edge cases. Relying solely on raw metrics leads to the "circular logic pitfall," where you optimize for clicks rather than clarity. To avoid misinterpretation, you must treat data as a signal, not a conclusion, balancing quantitative "what" with qualitative "why."
|
Metric |
Common (Mis)interpretation |
Potential Reality (Context) |
|
High Page Views |
"This feature is the most popular." |
The UI is so confusing that users are forced to seek help. |
|
High Bounce Rate |
"Users hate this content." |
Users found the answer immediately and left satisfied. |
|
Long Session Duration |
"The content is engaging." |
Users are frustrated and cannot find the specific information. |
|
Low Traffic |
"This content is useless; delete it."
|
The feature is "set it and forget it," but the docs are critical for setup. |
The Pitfall of mis-interpretation
The danger lies in survivorship bias and false causality. If you delete every low-traffic page, you might remove the Emergency Reset instructions. Data shows they aren't used, but when they are needed, their absence is catastrophic. Effective analysis requires triangulation: combining your page hits with support ticket trends and direct user feedback to ensure you aren't just polishing a page that shouldn't need to exist in the first place.
And frankly, some pages just need to exist even if they don’t have traffic. The reasons may range from compliance, through contractual obligations, to the plain and simple fact that the page documents a feature of your product.
Frequently Asked Questions About Confluence Analytics
What is Confluence Analytics?
Confluence Analytics is a set of built‑in analytics features in Confluence Premium and Enterprise. It shows how content and users behave over time, so you can track views, edits, comments, searches, and more across your entire Confluence site, individual spaces, and single pages.
Who can use Confluence Analytics?
Confluence Analytics is available on Confluence Premium and Confluence Enterprise. Analytics for individual pages is also available for Confluence Standard. Whether you can access site‑, space‑, or page‑level analytics also depends on your space permissions and any additional rights granted by your Confluence admin.
How do I access analytics for my whole Confluence site?
To view site‑wide analytics:
-
Open the Apps menu in the top navigation.
-
Click Analytics.
If you don’t see this option, contact your Confluence admin to confirm your plan level and permissions.
What does click‑through rate (CTR) mean in Confluence search?
Click‑through rate (CTR) is the percentage of users who:
-
Search for a specific term in Confluence.
-
Click a page in the search results.
A low CTR usually means your page titles, structure, or overview pages don’t match what users expect when they search for that term.
How can I improve search results and CTR in Confluence?
To improve how well people find and click your pages:
-
Rename pages to match how users actually talk and search.
-
Create overview pages for broad or generic topics.
-
Make sure key pages are linked from prominent spaces and home pages.
-
Regularly review Most popular searches in Analytics to find terms that need better content or clearer titles.
Can I export Confluence Analytics data?
Yes. In many Analytics views you can:
-
Click Export as CSV.
-
Save the file on your computer.
From there, you can analyze it further, build custom charts, or combine it with other data sources.
How can I use analytics to clean up outdated content?
Use space and page analytics to:
-
Identify pages with very low views.
-
Check whether they’re still relevant or required for compliance.
-
Decide whether to update, archive, or delete them.
-
Review attachments that are rarely used and remove or replace them.
How do I identify my Confluence power users and champions?
In Most active readers and Most active contributors:
-
Look for users who frequently:
-
Create or edit content
-
Comment and collaborate
-
These users often make great content owners, reviewers, and Confluence champions who can help you drive adoption and maintain quality.
I’m using Scroll Sites to create my public documentation site. Can I still use Confluence Analytics?
A site generated with Scroll Sites is independent of Confluence so you cannot use Confluence internal analytics. However, Scroll Sites supports out-of-the-box integration with several site analytic solutions such as Google Analytics or Cloudflare.
For more information, see Analytics Integration in Scroll Sites documentation.
Recommended Reading
