Creating Beautiful Tables in Atlassian Confluence
Creating Beautiful Tables in Atlassian Confluence
Tables are often the quickest way to communicate and structure large amounts of complex data which would otherwise be difficult for readers to consume.
Large volumes of structured information can be displayed neatly and logically in tables. Take this for example:
In this article, we'll cover:
- When to use a table
- How to provide context with tables
- How to keep your tables simple and clean
- How to create beautiful tables

When To Use a Confluence Table
In Confluence, it's easy to insert a table into your content and there are dozens of ways to use tables to communicate important information. For example:
- Marketing teams can track campaigns in one concise overview table.
- Product teams can break down product roadmaps to better communicate what's being built and when.
- HR teams can manage employee information like title, start date, contact data, team assignments and more.
How do you decide when a table makes sense? Use a table when readers need to look up specific things like locations, pricing, age etc. Large amounts of information like this are best presented in a table rather than plain text or a figure. Figures like an image, diagram or a chart are great for displaying data which is better consumed in a visual way.
Speaking of charts, if you want to show a trend based on numeric data, you can add your data to a Confluence table then turn it into a chart using the chart macro.
There are plenty more use cases for creating tables – we're sure you already have one in mind!
Bring in Context
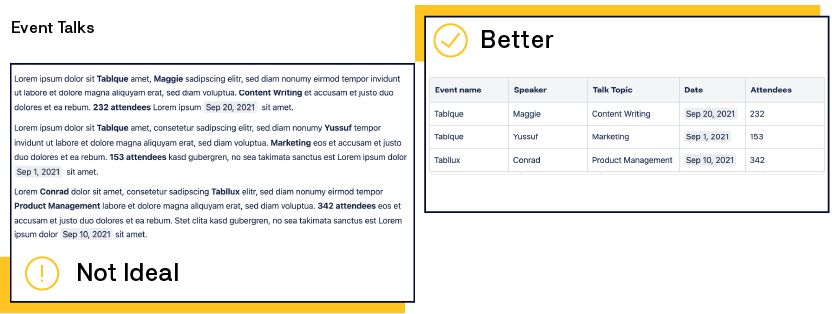
Most readers won't read big chunks of text on your Confluence pages. Instead, they'll jump directly to the table to look up the information they need.
With this in mind, make sure your tables can stand alone and still highlight the important information you want to communicate without too many extras on the page .
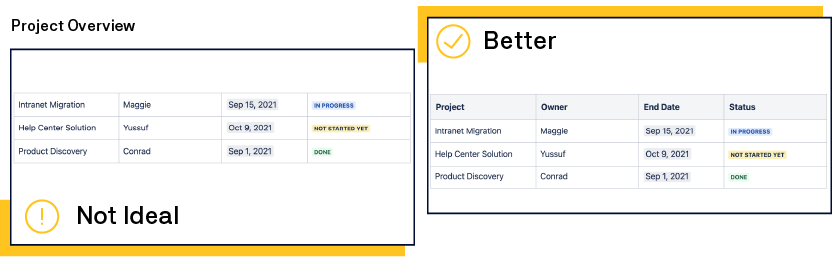
Remember to provide the full context for your rows and columns, meaning to name them properly so that your readers understand the single values in your table cells and can find information quickly and easily.
Highlight the Details
Although it's tempting to put all the data you have into your table, keep in mind that the more information you provide, the longer your reader will need to find the piece of information they are looking for.
The less columns and rows you have in your table, the better the readability is for your team. Especially if they're viewing the table on mobile!
Here are some tips to keep your tables narrow and clean:
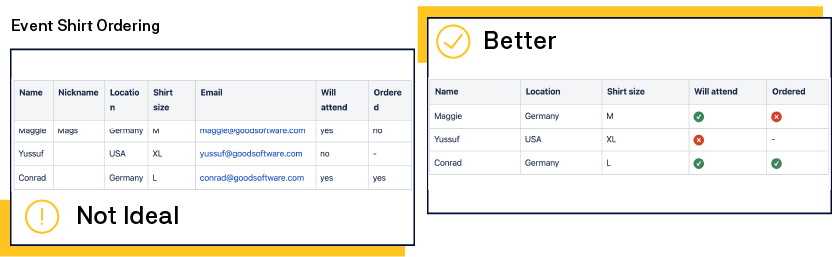
- Add only the essential information your readers need.
- Minimize your use of text in table cells by using icons instead of text. E.g.
 or
or  can communicate whether something is complete or not.
 - Consider the orientation of your table. It's easier for most people to skim through information that's vertically aligned versus horizontally aligned, especially if the information is sorted.
- If it makes sense, split a large table up into smaller tables.
It's important to consider how your table looks on mobile if you publish your docs – including your tables – as a help center.
With Scroll Viewport for Cloud or Instant Websites for Confluence you can turn your Confluence content into a beautiful, fully responsive help center.
Scannable and Beautiful
Once you have the most important information nailed down in your tables, a sprinkling of visual formatting can improve the readability and searchability of your content.
To make your tables both beautiful and easy to scan, use simple but powerful rich content and macros like:
- Simple text formatting
- Bullet lists
- Colors
- Emoticons
- Admonitions (e.g. the Confluence tip and note macros)
But fair warning: Too much rich content like images, headings or too many Confluence macros will make it difficult for the reader to scan information as the page will appear busy. Instead, lead your readers' eyes to important information by highlighting particular parts to help them navigate the table.
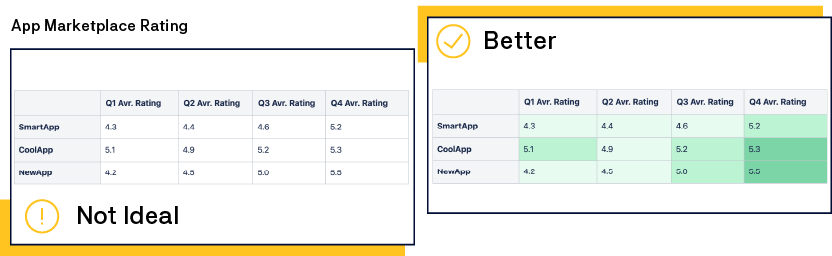
Distinguish different data sets or categories from each other by using different cell colors. This helps readers focus on the information within the category they need. When colors are used correctly, you can direct attention, improve readability and comprehension, as well as promote association and recall of information.
For example, to compare numbers, make the most important number bold or create a heatmap where the highest number has the darkest color and the lowest number the lightest.
There’s an App for That!
With the default tables in Confluence Cloud, you are able to adhere to all the best practices mentioned above. But there are many apps available on the Atlassian Marketplace that enable you to do even more with your tables.
On the Atlassian marketplace you'll find some apps to improve your default Confluence tables:
- Advanced Tables for Confluence by BobSwift. This app enhances your Confluence tables with column totals and averages, numbering, sorting, and CSS styling. It also enables filtering and adds a search field for your table. This helps your readers search for a specific entry they are looking for in your table.
- Table filter and charts for Confluence by Stiltsoft allows you to filter static and dynamic Confluence tables, aggregate data in pivot table reports, transform tables and build dynamic charts, and more.
- Confluence Databases is very useful for simple tables containing many different metadata-types. It also allows you on-the-fly editing of tables (without opening the editor) and comes in handy when you reuse or reference data a lot. You can connect data from several tables to each other and it offers a lot more features to structure your data.
Over to You...
Now, we'd like to hear from you:
- How do you manage tables in Confluence?
- Which best practices from this article have you already embraced?
- Have we missed a best practice your team uses?
Let us know in the comments section, or drop us an email at rockthedocs@k15t.com.
Bonus: Shortcuts for Tables in Confluence Cloud
Create tables even faster with these handy shortcuts for tables in Confluence Cloud!
SHIFT + OPTION/ALT + T = New Table
CONTROL + OPTION/ALT + RIGHT = New Column
CONTROL + OPTION/ALT + DOWN = New Row
CMD + DELETE = Clear Cell


